Causal Loop Diagram
Presenter(s): Avanthika Kamath, Freya Ivy Palmer, Imali Manikarachchige, Craig Hutton
A Causal Loop Diagram (CLD) represents any system in a simpler visual form. It includes variables, the relations between them, causal effects, and emergent “loops” (that can provide feedback). Drawing a CLD helps in identifying and exploring the feedbacks, trade-offs, and synergies of a system. As such, a CLD represents an initial step in the development of complex, dynamic systems diagrams, and models. ‘System’ in this context is a set of elements and their interconnections, organized to serve a purpose, such as: ecosystems, the human body, a sports team, weather system.
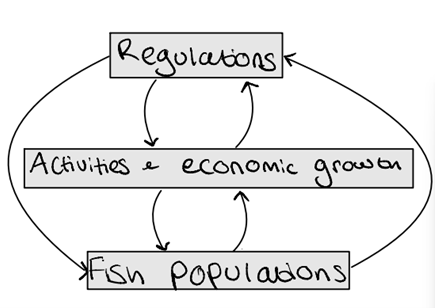
A CLD can be applied to any complex system and is particularly valuable for capturing key components of the interactions and feedback loops of social, economic, and environmental aspects. An example is the UK fisheries, where we consider fish population, economic outputs, jobs, and fishers’ population as variables; fishing regulations, economic processes, and population dynamics, become the interconnections between these variables. These interconnections can feed back into loops that further drive change across the system. Similarly, football teams, UK agriculture, the healthcare - indeed any organizational context - are all systems with different levels of complexities. The CLD approach is derived from systems thinking and the conceptual components of systems dynamics modelling and can utilise multiple inputs in their construction extending from expert opinion, well established relationships to diverse forms of literature.
Diagram 1: Fisheries system:
.
Advantages and drawbacks of CLD:
This visually appealing, easy to use systems map describes any system’s dynamics in a flexible, inclusive manner. It is not limited to tangible, quantitative data and is intended to give a holistic understanding of a complex system. The maps provide a clear stepping-stone to producing more formal systems dynamics models (SDMs). Although they focus on relationships between variables and the associated feedback, the freedom of designing these loops lies solely on the researcher/creator. This is both an advantage and disadvantage as CLD captures complex relationships, but it also requires that the designer is aware of what is not represented in the system and the geographical and temporal scale to which a CLD may or may not be representative. As such, a CLD needs to be thought of as a qualitative expression of a level of understanding of a system as opposed to a detailed simulation.
Another area of interest across CLD and indeed any subsequent systems models is the capacity to support the connections drawn. Whilst clearly a difficult thing to pin down in such a qualitative approach, the usual response is to consider the fit to literature and discuss the CLD with various stakeholders represented in the map to justify the relations are effective and in line with the real-world scenarios.
Applications of CLD:
CLDs can be applied in any scenarios involving single or multiple cause-and-effect relations and feedback between various elements. CLDs can be applied to systems as simple as a ‘money in a bank account’ scenario with changing incomes, outcomes, and interest rates, to a very complex ‘obesity system in the UK’, showing the diverse applications a systems approach can aid. CLDs are applied to delineate multiple stakeholders and their involvement, to understand the behaviour of any system, to identify the pattern over time and predict the behaviour of a system.
The notation used in creating CLD:
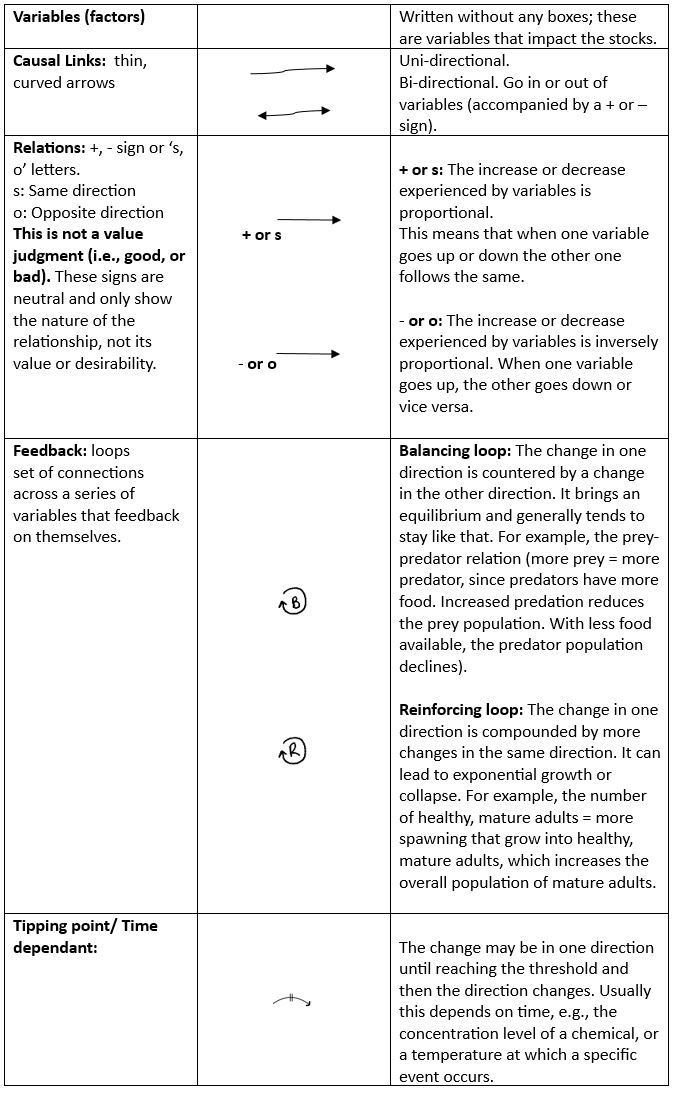
> Download this table as Word document for accessibility.
.
A simple example:
Diagram 2: A simple CLD of prey-predation of cod population. Please note that these are in theory, with the context of this CLD ignoring the other factors that influence these relations:

.
We know that juvenile cods grow into adult cods by feeding on its prey. The adult cods mature and spawn, producing juvenile cods, adding to their population. However, adult cods are predated by other fish decreasing their population. This is represented in the simple CLD above.
Balancing loops: Higher prey population, higher the predator population, but higher the predator population, lower is the prey population (because the predators feed on their prey).
Reinforcing loop: Higher adult population leads to spawning and higher juvenile population which grows into adults (reproduction and growth of cod).
Example of Cod Fishery in the UK:
Let us look at the CLD drawn in the video above, answering the question, ‘what impacts cod fish population?’ Looking at the environmental, social, economic, and regulatory factors, their causal relations, and the feedback loops.
Diagram 3: Environmental aspects impacting the cod population:
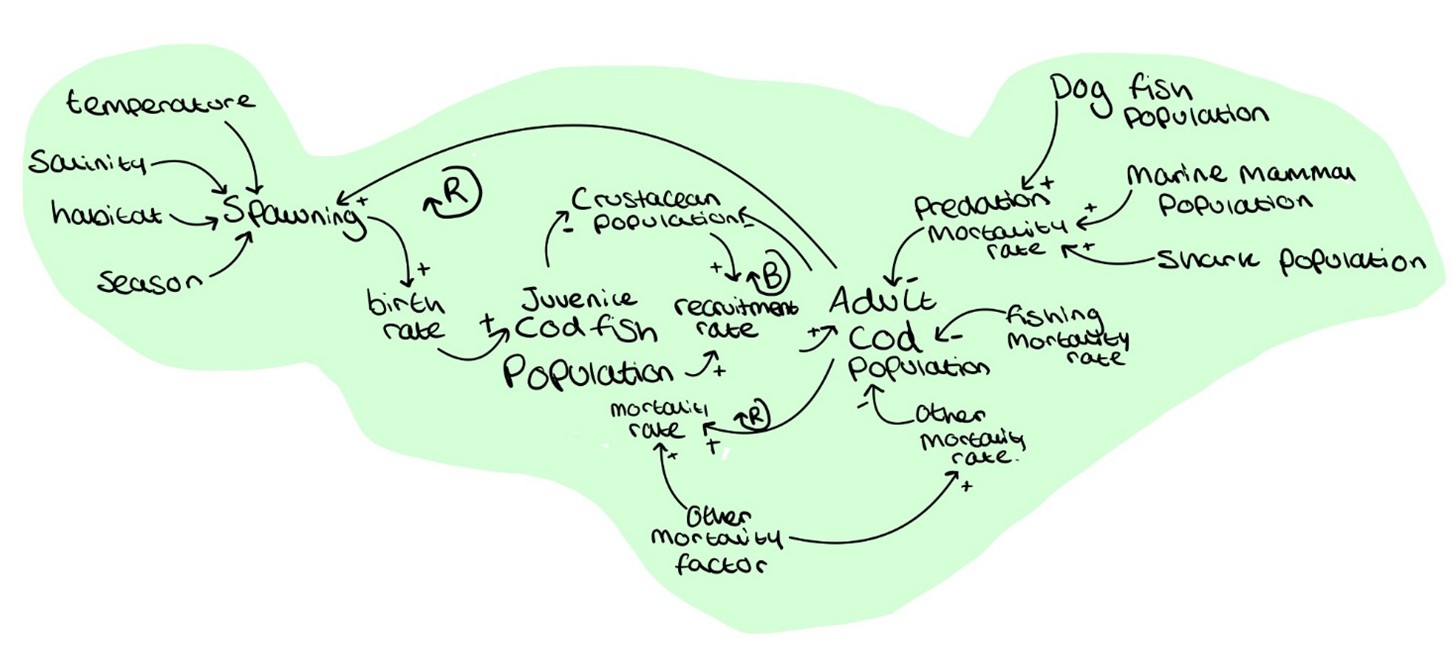
The core of this CLD is the variable juvenile cod and adult cod population (both quantifiable) and factors that support the inflows, increasing their population and outflows, decreasing their population. Other variables are the ones that either help in increasing (prey population and spawning) or decreasing the population (predator population, fishing, and other mortality factors). The loops that are balancing the population or reinforcing an increase in the population.
Diagram 4: Social aspects impacting the cod fish population:
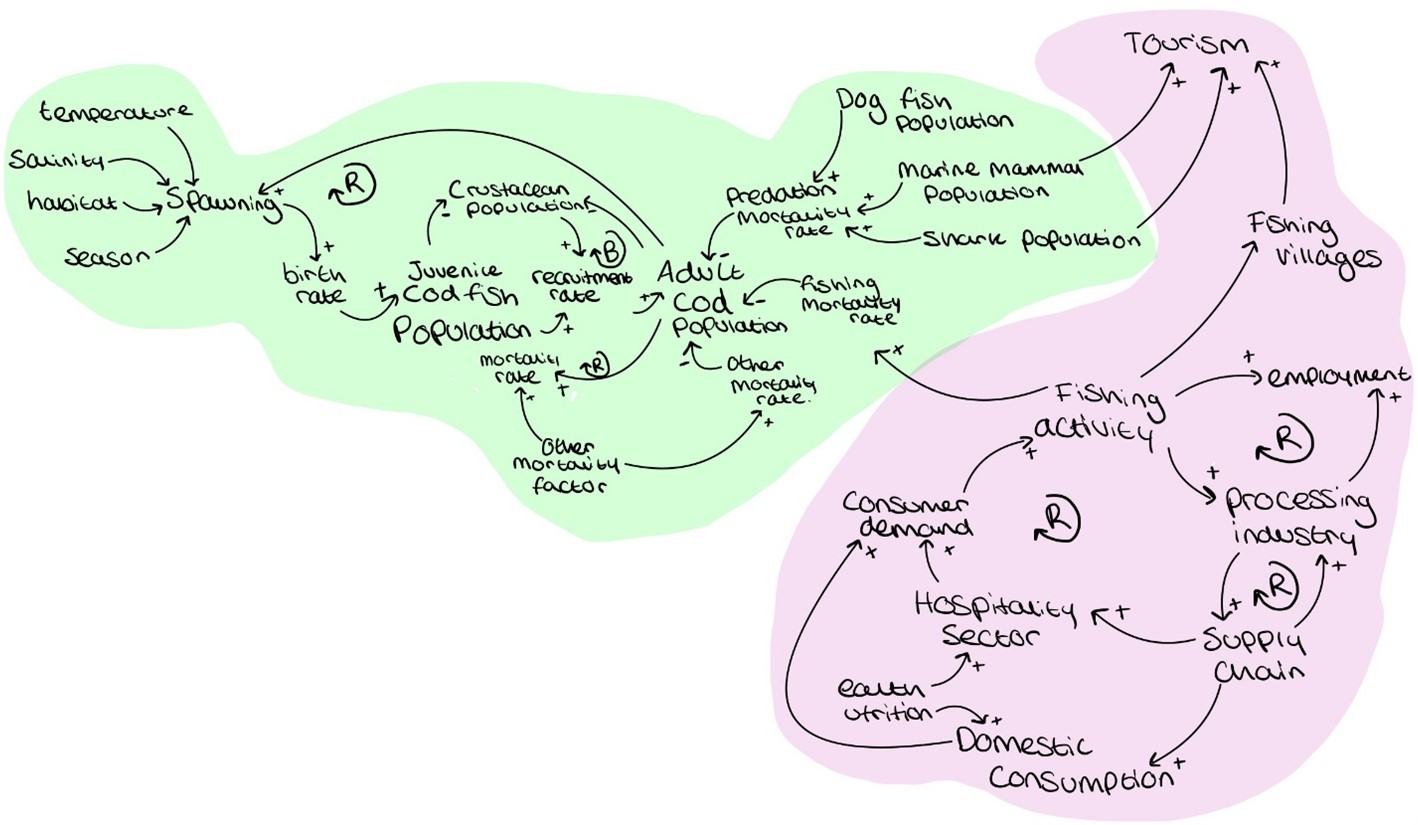
Here, we have added social aspects (purple) such as consumption, industries, employment, tourism, and other factors. How they impact fishing activity which further decreases the cod population and the reinforcing loops increasing the fishing activity.
Diagram 5: Economic aspects impacting the cod population:
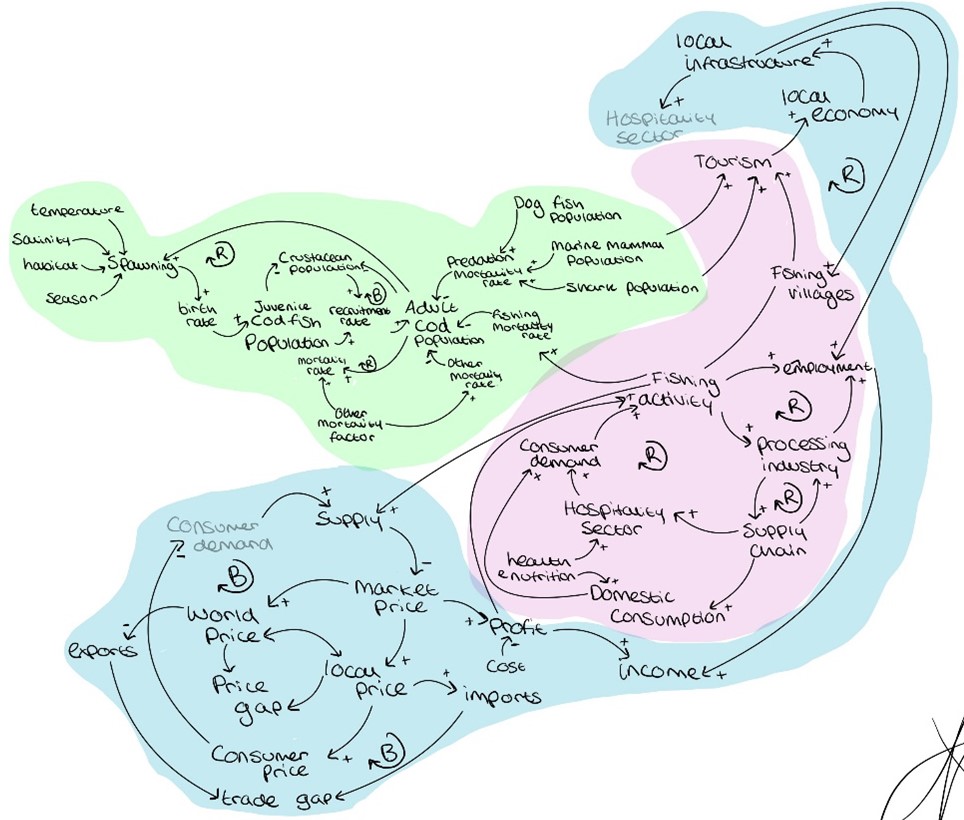
After looking at the social variables and their relations, it is quite easy to put together how these drive the economy. Hence, we look at the variables like world market price, local market price, exports, and imports, supplies and other variables and their interconnections. Demand and supply are dependent on price, making a balancing loop.
Diagram 6: Regulatory aspects impacting the cod population:
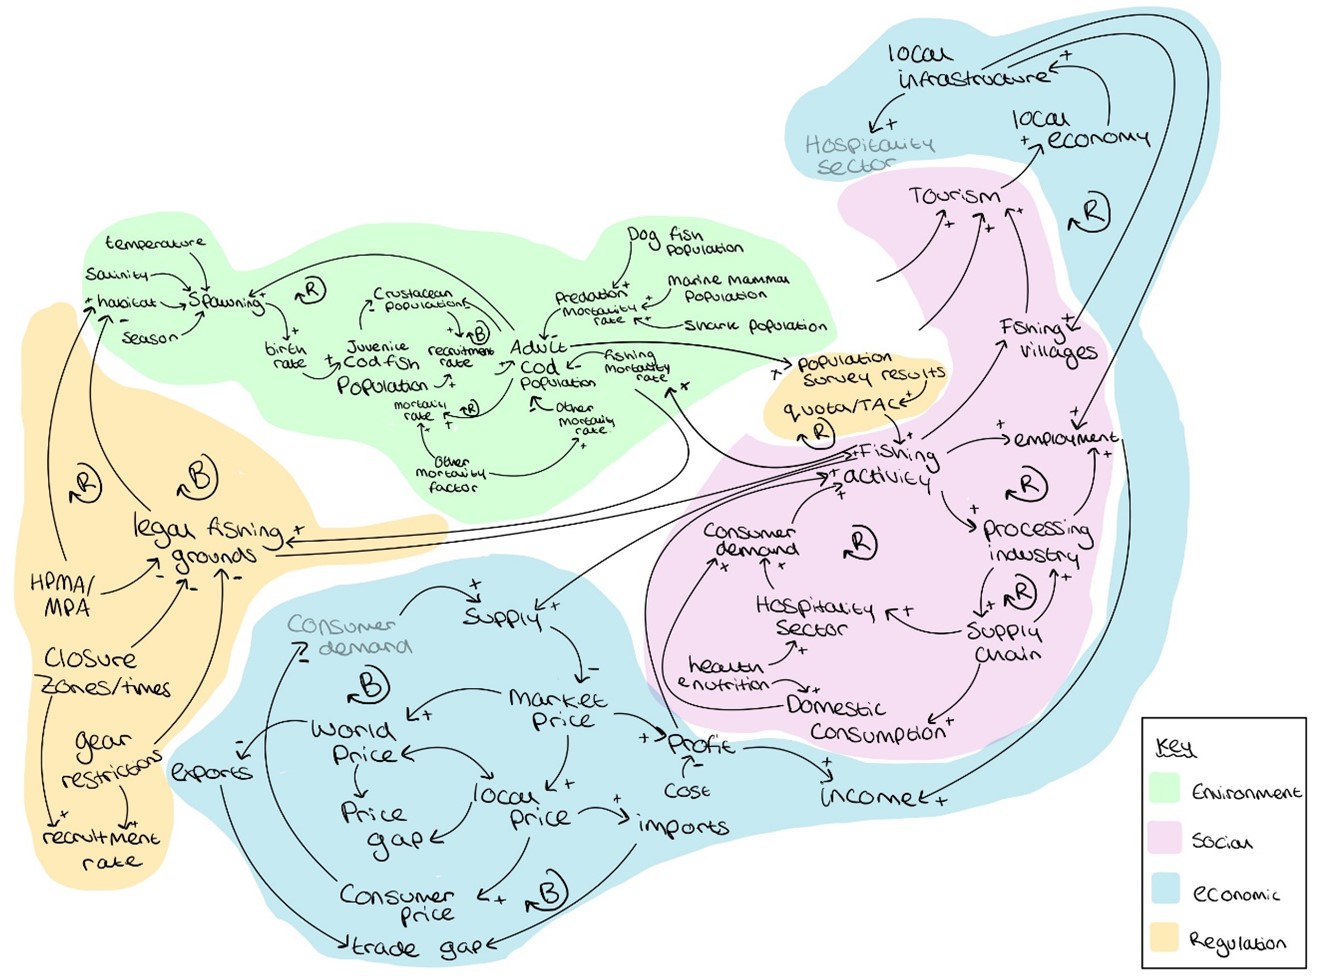
Fishing activities are governed by a set of regulations, helping in sustaining the cod fish population. The variables like gear restrictions, fishing grounds/zones, quotas, surveys and other factors and their effect on the different variables of our system are shown in the CLD above.
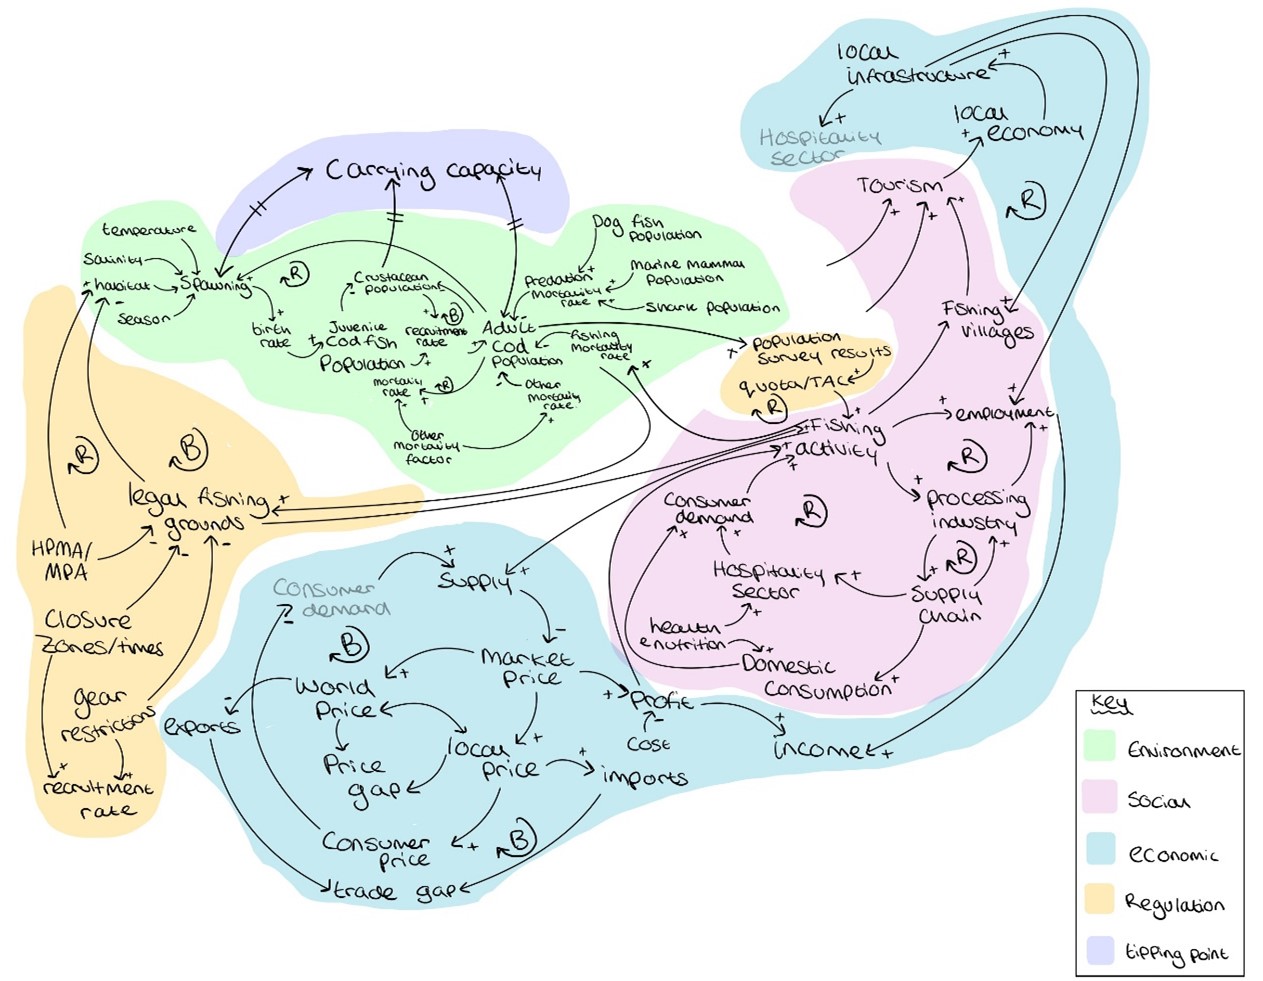
Next, we have just added the tipping point. A relation between a few of the variables that are dependent on time. This might behave in a certain manner until a threshold is reached and change its behaviour post that. Carrying capacity is the tipping point in this CLD.
Diagram 7: CLD telling the story of what impacts cod population in the UK:
Download:
About the author
Imali Manikarachchige is a 2nd year PhD student at the Faculty of Engineering and Physical Sciences, University of Southampton. Her research interests are grounded in adopting a systems thinking approach to diagnose multifaceted vulnerabilities in fisheries socio-ecological systems.
Freya Ivy Palmer is a 1st year PhD candidate at the Faculty of Engineering and Physical Sciences, University of Southampton. Her research considers the complex connections between the social, economic, and environmental components of sustainability and how shocks (i.e. big impactful events) can cause widescale disruptions within UK marine fisheries.
Avanthika Kamath is a 1st year PhD researcher at the Faculty of Engineering and Physical Sciences, University of Southampton. Her research concerns the sustainability of sourcing raw materials from wild caught fish for reduction fisheries, a case study in India.
Professor Craig Hutton has worked in sustainable development for 25 years. Prof. Hutton’s applied research lies at the intersection between development, adaptation and the social and policy implications of environmental/climate change and sustainable management.
- Published on: 10 September 2024
- Event hosted by: Southampton University
- Keywords: Systems thinking | causal loop diagrams | dynamic interactions | qualitative method | visualise complexity |
- To cite this resource:
Avanthika Kamath, Freya Ivy Palmer, Imali Manikarachchige, Craig Hutton. (2024). Causal Loop Diagram. National Centre for Research Methods online learning resource. Available at https://www.ncrm.ac.uk/resources/online/all/?id=20845 [accessed: 13 December 2025]
⌃BACK TO TOP


